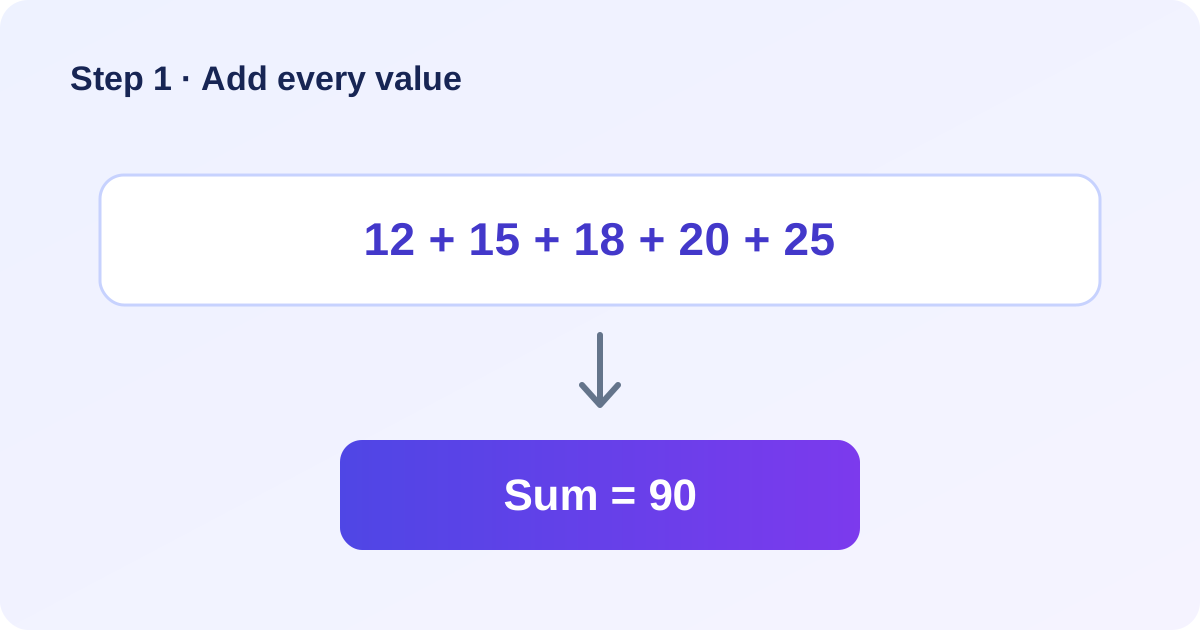
1. Add all the values
Combine every number in your list to find the total sum. Include repeated values because each entry contributes to the dataset.
Add, subtract, multiply, divide and simplify fractions. Get exact results, mixed numbers, decimal values and clear step-by-step working.
Your numbers are processed in your browser and are not sent to a server.
Use this average calculator to find the arithmetic mean of a list of numbers in seconds. Enter your values once to see the mean, median, mode, range, sum and number of entries together. It is useful for checking class results, comparing measurements, reviewing survey responses and working with everyday data.
The mean is commonly called the average, but it is only one way to describe a dataset. Median and mode provide additional context, while the range shows the distance between the smallest and largest values. Seeing these measures together can make it easier to understand how your numbers are distributed.
If you need help setting up or understanding a longer equation behind your data, the AI maths problem-solving assistant can help you work through the mathematical steps.
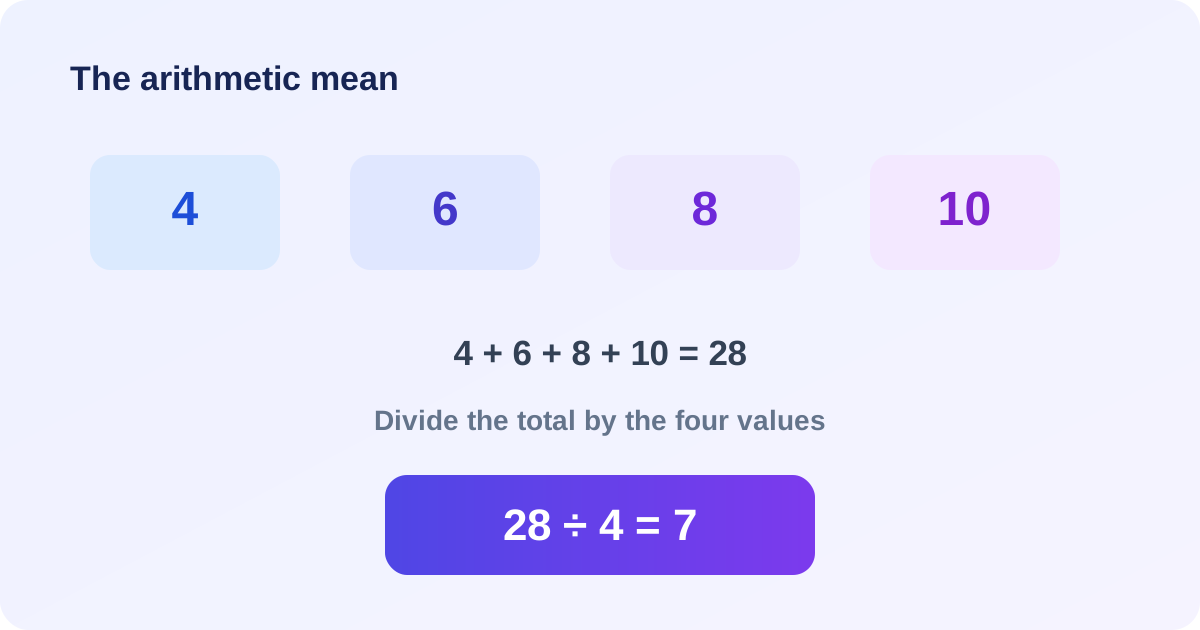
The arithmetic mean is found by adding every value and dividing by the total number of values. If your dataset contains fractional values, you can check those operations separately with this fraction calculation and simplification tool.
Combine every number in your list to find the total sum. Include repeated values because each entry contributes to the dataset.
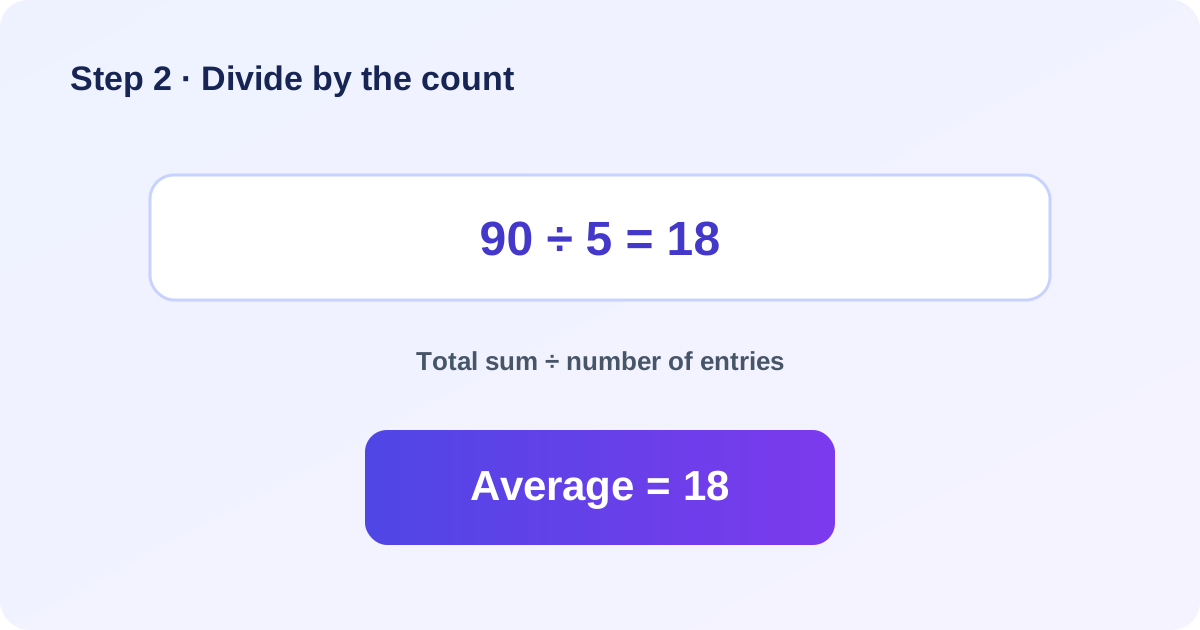
Count how many numbers you entered, then divide the sum by that count. The result is the arithmetic mean.
The formula for the arithmetic mean is:
Average = Sum of values ÷ Number of values
For the values 4, 6, 8 and 10, the sum is 28 and the count is 4. Divide 28 by 4 to get an average of 7. When you need to check powers, roots or trigonometric values as part of a wider calculation, use the scientific maths calculator.
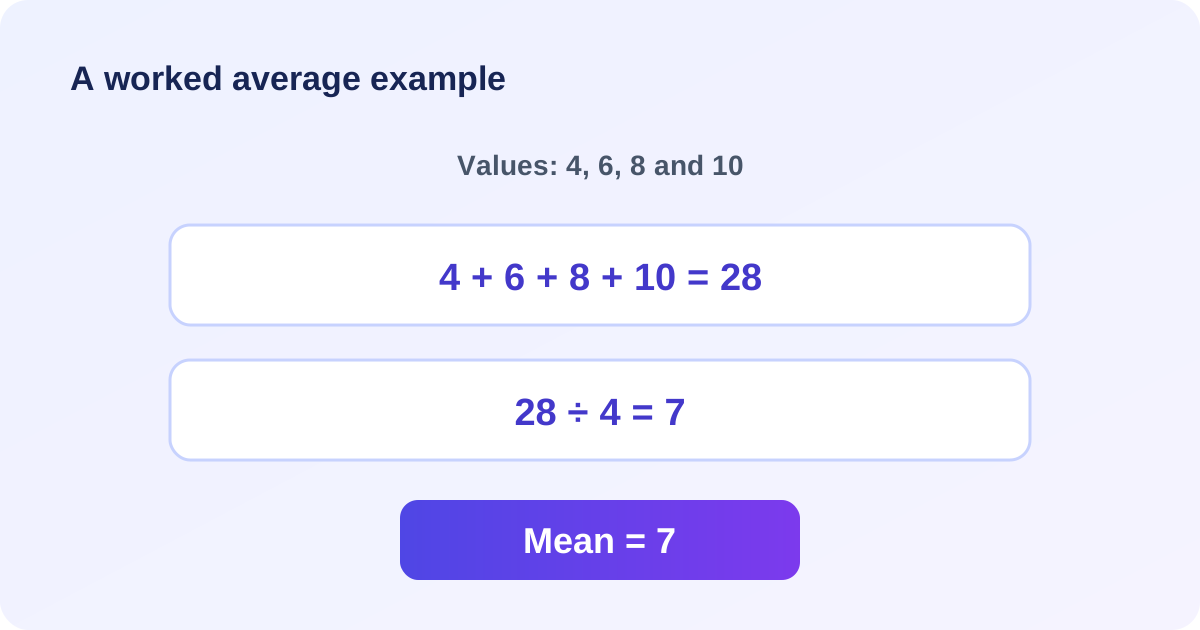
Imagine four test scores: 4, 6, 8 and 10. Add the scores to get 28. Since there are four scores, divide 28 by 4. The mean score is 7.
The mean is the sum of all values divided by the number of values. It uses every entry, so unusually high or low numbers can affect the result.
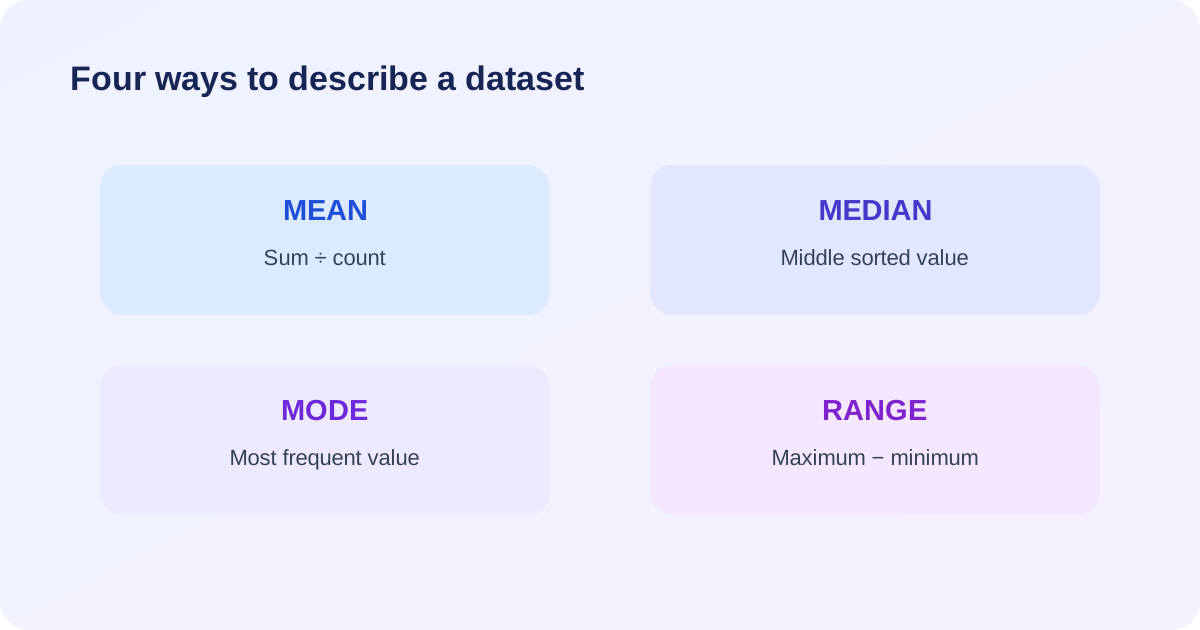
The median is the middle value after sorting the list. With an even number of entries, take the average of the two central values.
The mode is the value that appears most often. A dataset can have one mode, multiple modes tied for the highest frequency, or no repeated value.
The range describes the spread from the lowest to the highest value. Subtract the minimum from the maximum to calculate it. If you want to express how much one value has increased or decreased relative to another, use the percentage difference and change calculator.
Choose another tool when your calculation calls for a different mathematical operation.
Add all the numbers together and divide the sum by the number of entries. This gives the arithmetic mean.
In everyday use, average usually refers to the arithmetic mean. Mean, median and mode are distinct statistical measures.
Yes. This calculator accepts positive numbers, negative numbers and decimals. Use a dot for decimal values.
If two or more values share the highest frequency, all tied values are displayed as modes.
No. Calculations happen in your browser and the values you enter are not uploaded to the website.
Enter your values above to calculate the mean and review other useful measures of your dataset.
Start calculating ↑The mean uses every value in the dataset, so unusually high or low numbers can pull it away from the centre of most observations. The median is the middle value after sorting the data. The mode is the value that appears most often. These measures describe different features, and looking at more than one can give a clearer picture than relying on the mean alone.
Consider the values 4, 5, 5, 6 and 30. Their sum is 50, so the mean is 10. The middle value is 5, so the median is 5, and the mode is also 5. The high value of 30 raises the mean, while the median better represents the centre of the four smaller observations.
Check that every entry uses the same unit and that missing observations have not been entered as zero unless zero is a real measurement. For example, a blank test score is not automatically the same as a score of zero. If your dataset represents parts of a whole, the percentage calculator can express each category as a share of the total.
If you need to compare two quantities in a fixed relationship, use the ratio calculator. For fraction-based data, the fraction calculator can simplify exact values. For a formula involving powers or roots, use the scientific calculator.